Summary
In this lab students studied the process of osmosis by observing red onion cells in different solutions. Osmosis is the diffusion of water, meaning that water goes from a high concentration to a lower concentration of water molecules.
To observe onion cells, scholars peeled off red skin from onion chunks and placed them over a drop of water on a microscope slide. A cover slip was then placed over the onion cells, starting at a 45 degree angle in order to avoid air bubbles.
Scholars made initial observations of the cell wall, cell membrane, and cytoplasm of one onion cell.

Figure 1. First Observation: one drop of distilled water
Next, several drops of 10% salt solution was added to the side of the cover slip spread into the onion cells. Observations of the same cell were made again. Scholars noticed a smaller, shrinking cytoplasm.
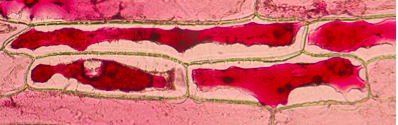
Figure 2. Second Observation: 10% salt solution
In the last step, scholars reintroduced distilled water into the cell, once again expanding the cytoplasm in the cell.
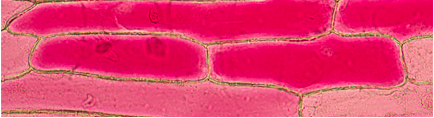
Figure 3. Third Observation: Addition of more Distilled Water

 RSS Feed